Welcome to the Artificial Intelligence Outlook for Forex trading.
VIDEO TRANSCRIPT
Hello everyone. Welcome back. My name is Greg Firman and this is the VantagePoint AI market Outlook for the week of April the 17th, 2023. Now to get started this week, we’ll begin where we always do, with that very important US dollar index.
U.S. Dollar Index
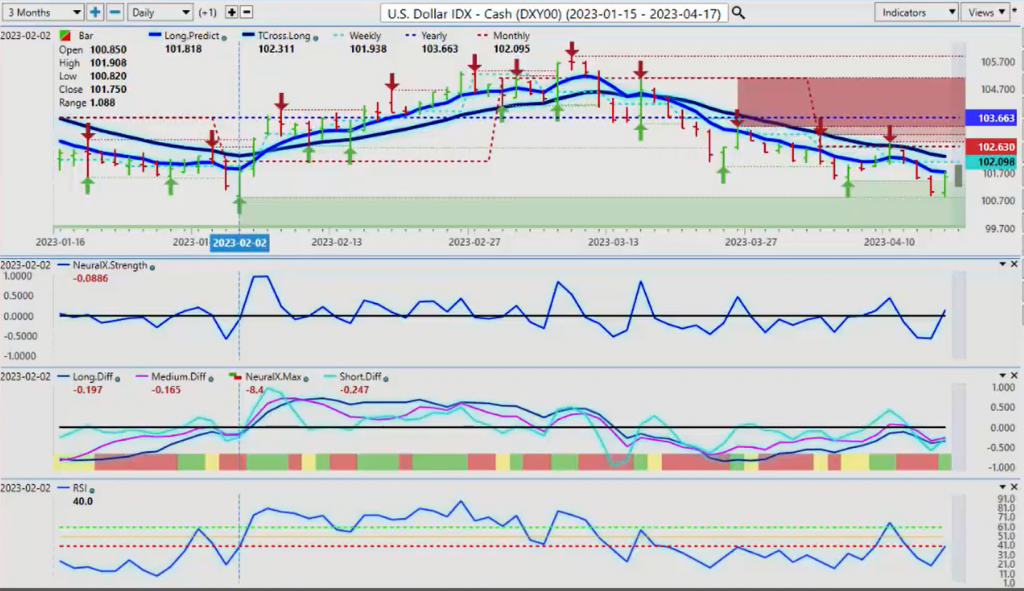
Now we can see the dollar is finding support off of the verified support low from February the second. We failed twice at this level. We’re getting a strong bounce on Friday. However, this very well could be profit-taking. We need to clear our vantage point long predicted at 101.70 and our TCross Long at 102.29. But with that, we can see we’re firmly below the yearly opening price and the monthly opening price. Now a point of interest, one of the questions I was asked last week is, what is the benefit of the monthly opening and the yearly price? The theory is that while the market is below these levels, it’s bearish.
While it’s above those levels, it’s bullish and it acts as a pivot point. So last week, we can see that the monthly opening price has intersected with the vantage point TCross Long at that time of 102.68, and then we had a significant failure off that particular level. Now, the benefit of the verified zones is they also tell us where our downside support is, where we should be very, very cautious about continuing shorts. So we may see a rebound to start the week. We’ve got our neural index stronger. Our neural index strength is pointing up, and we’re recovering with our predicted RSI. But this trend has not changed as of yet. The very first thing we would need is again, to clear the TCross Long and at least turn positive on the month, which to date we still have not been able to do.
Gold
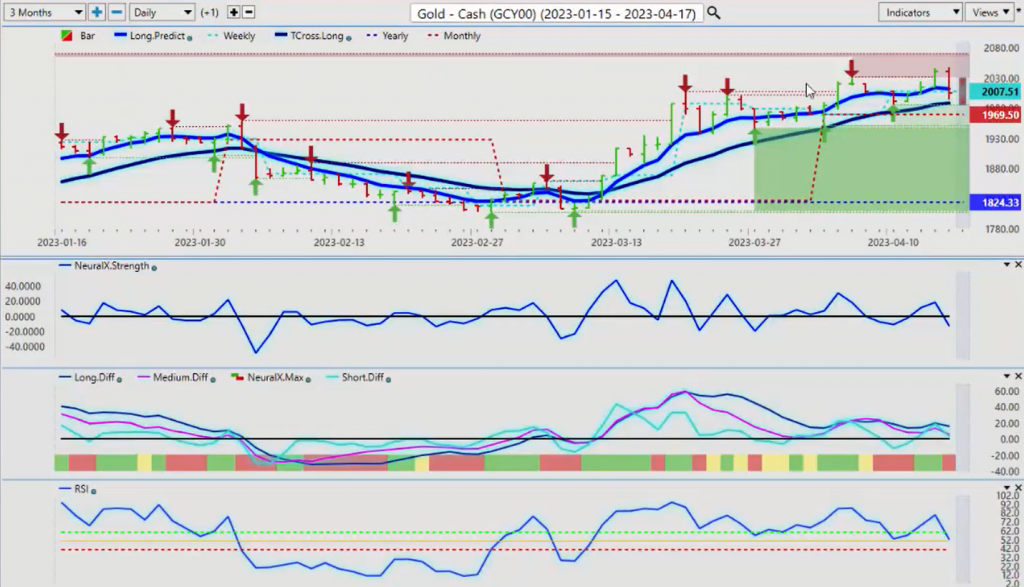
Now, gold prices, again, are hitting into, again, very significant resistance. But for now, gold is still favored to go higher, but nothing goes straight up and nothing goes straight down.
We have retracement points. Now, some people like to use different tools, further retracements, but the VantagePoint predicted moving averages provide a high degree of accuracy of where the market is likely to end those retracement points. They have nothing to do with Fibonacci or anything like that. Simply the calculation of 31 other markets correlated to the target market. So that level on gold is 19.88. We have the monthly opening price at 19.69. So we remain long while above these levels. But if we break through that, we have a deeper retracement, potentially back to 18.24. But respecting the fact that we’re likely to see some form of a recession later this year should keep gold firm. Now with the S&P 500, once again, the annual returns year to date are still very much positive. We haven’t been negative on an annual basis at all this year, we’ve had significant buying on dips. The yearly opening price, again, to further explain that, the market was very, very bearish on March the 13th.
S&P 500 Index
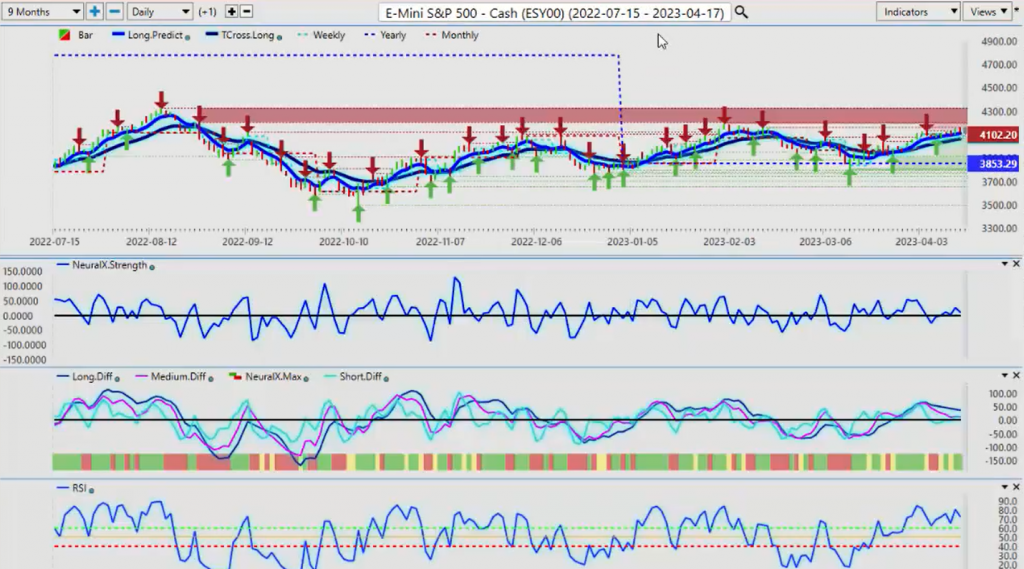
Most analysts saying we’re going lower, the S&P 500 and the spys have entered into a bear market, when that actually is not factual. We would have to be negative on the calendar year in order to start selling. Now again, I’m a happy seller below 3853, but while we continue to hold above this yearly opening price, we’re likely to see additional buying down at these levels. Now, for this coming week, we have significant verified resistance at the high, 4195. We need to break through that, and if we want to get out of this longer term channel, again, in my respectful opinion only, we really do need to at least come up and test the 4325 area. But again, we could see some sellers coming out this week if we get some additional dollar strength.
Bitcoin
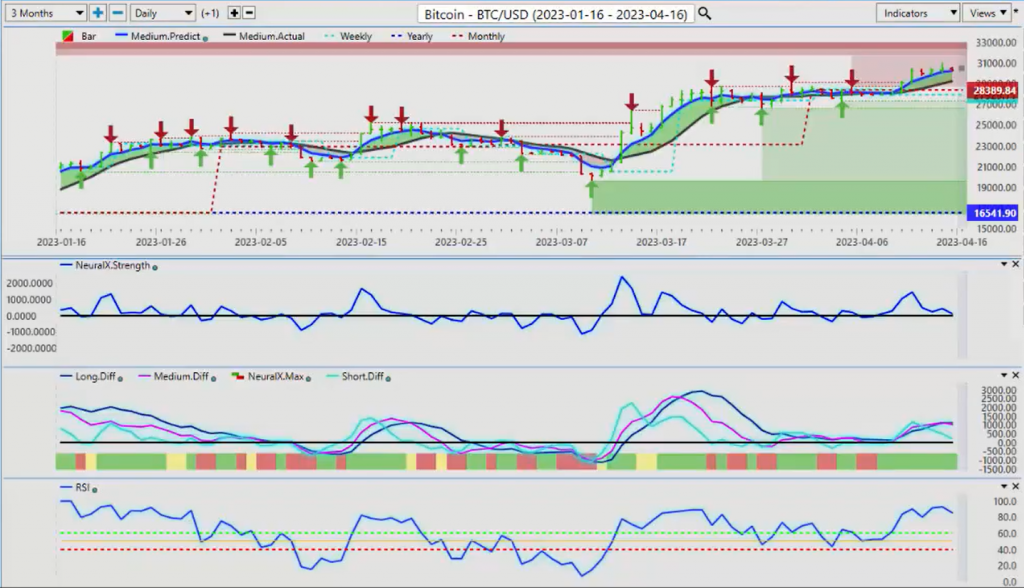
Now, when we look at Bitcoin, once again, you’ve got a lot of mixed commentary on Bitcoin. But probably one of my favorite sayings is facts matter here, guys. Bitcoin annualized returns 200 and some odd per 220% on a 10 year annualized basis. But again, in 2023, facts do matter. So when we look at this, we can see that this is Bitcoin is currently up 80% on the calendar year. I can’t even add up how many people, including Warren Buffet, Munger, these people saying, “Oh, bitcoin’s a scam, blah, blah, blah.” The reality here is, is this was a very powerful move up. Now you can see in basically the first two weeks of the calendar year, we remained firmly above the monthly and yearly opening price. This tells me that I don’t actually have people selling this, that we’re getting ready for a spike. The VantagePoint predicted moving average crossed. We held above those predicted moving averages. Any retracement, we’ve seen solid buying.
So again, when we look at these retracement points, it’s very important that we can identify first whether something is positive or negative on the calendar year. So Bitcoin has never been negative on the year for any more than a few minutes for that matter, but we remain bullish. But we could see, again, nothing go straight up and nothing go straight down here, guys. So we could see a bit of a retracement, and if I believe that if we do see that retracement, then again we want to make sure we’re looking at that TCross Long. So if I take my indicators and apply them right across each one of these pairs, click okay.
We come back, look at our Bitcoin, and we can immediately pull up those Vantagepoint predicted moving averages. So our first level of support at the long predicted, 29,963, but our TCross Long is the one you really want to keep your eye on, which is 28,867.
We’re firmly above the yearly, the weekly, and the monthly opening price. So we’re still bullish, but a retracement would be perfectly normal. We just want to make sure we’re holding and not closing below 28,867.
Light Sweet Crude Oil
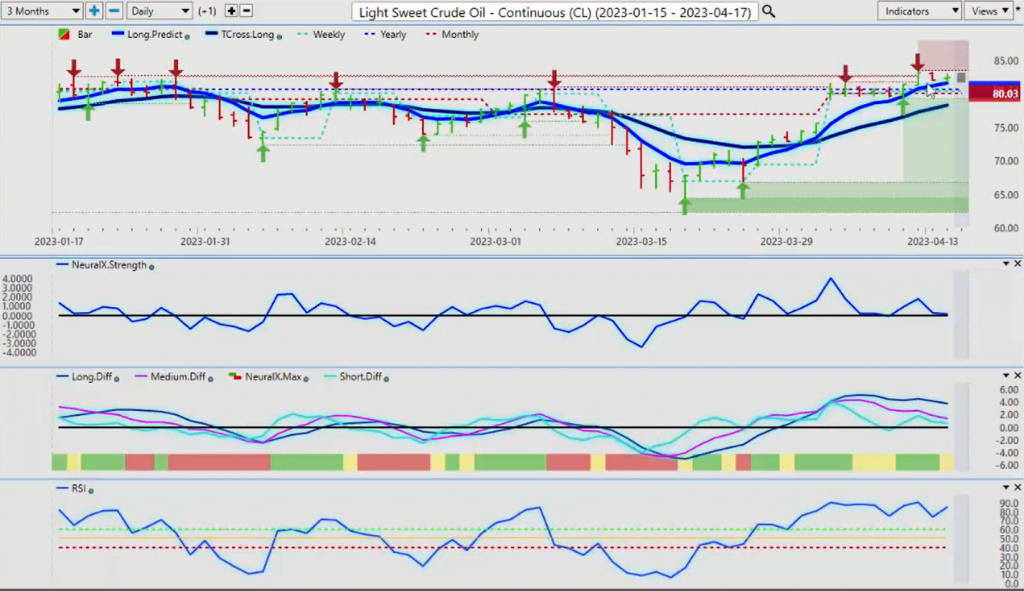
Now, light sweet crude oil turning positive on the year. It sure has taken some time for that to occur, but as you can see, we have a newly formed verified resistance high 83.42. But we did have some buying, but we really do need to hold above that monthly and yearly opening price. Again, if we’re above the yearly opening price, we’ve got a bullish tendency here, and we can use that yearly and monthly opening price as a pivot point at 80.03 and 78.34 as a potential buying area. Now, we do have the predicted high and predicted low for the day, but that’s for one day. So if we get into some more volatility, then again, we want to look to these medium and longer term levels as an area to still stay with the primary trend.
But again, I would prefer to stay above 80.73. So another way you can play this is you can have cell orders ready to go at say, 79.90. If we break down below that, then that would take the pressure off the top side and the primary trend down would likely continue.
Euro versus U.S. Dollar
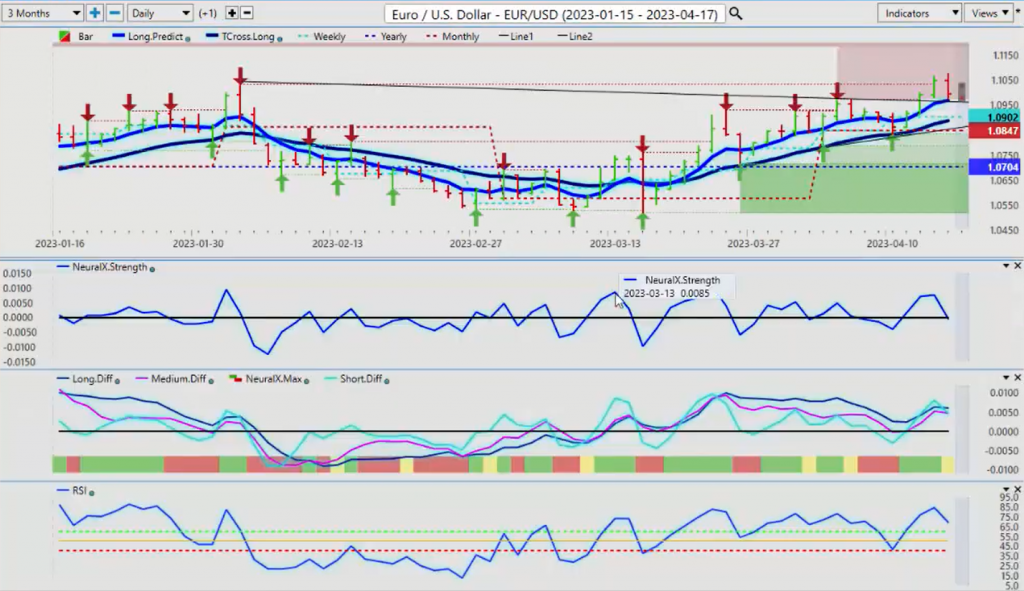
Now, as we look at some of our main forex pairs for next week, once again, the Euro benefiting significantly from this dollar weakness. But we’ve had a break of a wedge formation. I’ve drawn two trend lines in here. You can see we’ve broken that trend line right here. Then we’ve used the top end of that trend line where the buyers are coming in. I believe that more likely than not, we’ve had some profit taking on Friday. So we’ll watch those key vantage point levels. But in order to stay long the Euro and short the dollar, we need to stay above 108.88.
But once again, you can see using that monthly opening price as a pivot point, and when we have our TCross Long or our long predicted, that intersects with either the monthly or yearly opening price that represents a very powerful area to stay with the primary trend, which is clearly up on the Euro, 107.07. Yes, the Euro had a horrible year last year, but 2023 is not the same technically or fundamentally as 2022. So we want to make sure we’re not drag using rolling performance and dragging the wrong dates forward. We always want to make sure we’re starting at January 1st and going to December 31st. So for the year, the Euro has been positive for the last several weeks. We would look to build on those long trades and the dollar weakness.
U.S. Dollar versus Swiss Franc
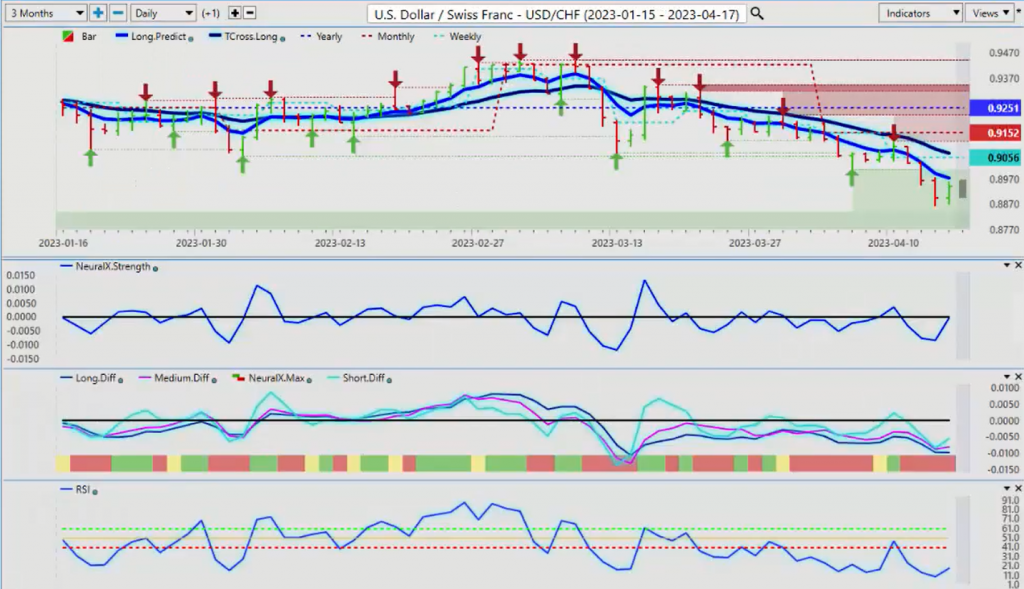
US/Swiss Franc, again, if the dollar is going to recover, then we would see some kind of a bounce, but we still don’t have our neural index turning positive.
The first area, we would have to clear, the long predicted 89.73. Then we would target the TCross Long at 90.71. But again, this would just be a retracement guys, we’re not in a new trend. We’re below the monthly opening price. Were below the yearly opening price. We would have to clear both of these levels to start an uptrend. We can’t say something isn’t an uptrend if it’s negative on the month and negative on the year. It’s a very simplistic way to clearly identify whether the buyers or sellers are in control of any particular market.
British Pound versus U.S. Dollar
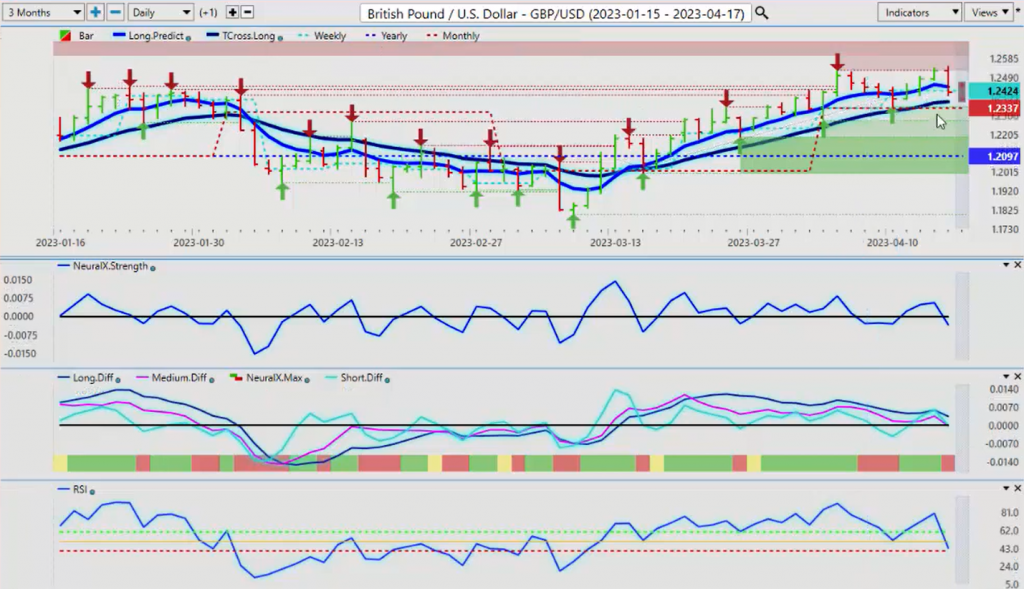
Now, if the dollar does gain some additional strength, then we would see the pound dollar moving lower. But again, my optimism on that remains guarded. The first level, and again, we’ve got our monthly opening price, 123.37. That’s intersecting again with the predicted moving average. The TCross Long at 123.69.
So again, if we can hold above that level, then the primary move higher will continue. We’re positive on the year, 120.97, but the indicators are showing that we’re we’re going to move lower before we move higher. Now, be careful of that Monday Tuesday reversal that I’ve talked about. If we get a big move up on this pair on Monday, be careful on Tuesday for a substantial selloff is what I would warn.
U.S. Dollar versus Japanese Yen
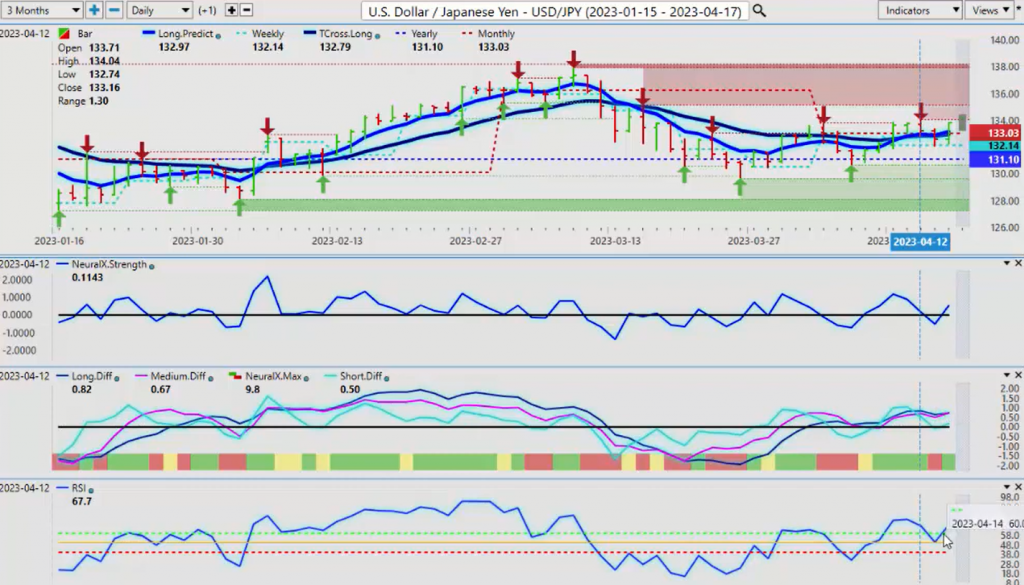
Now, the dollar yen, once again, the carry trade under a little bit of pressure here. But again, we’re not clearing our most recently formed verified resistance high, that coming in at 134.04. Our indicators are turning positive again, our predicted RSI is showing momentum. So watch this pair very closely. But this pair will be very, very volatile with everything that’s going on with China and the US and just the volatility with the Fed, the Bank of Japan and the Federal Reserve, the interest rate differential.
But this is by definition the carry trait to go long. So if it comes unwound, then you can also expect things like gold to move higher. If the dollar yen moves lower, then the inner market, direct inner market correlation is that will confirm additional longs on gold, but likely on Bitcoin also. So again, we’ll keep a very, very close eye on these developments as we go forward into the week.
U.S. Dollar versus Canadian Dollar
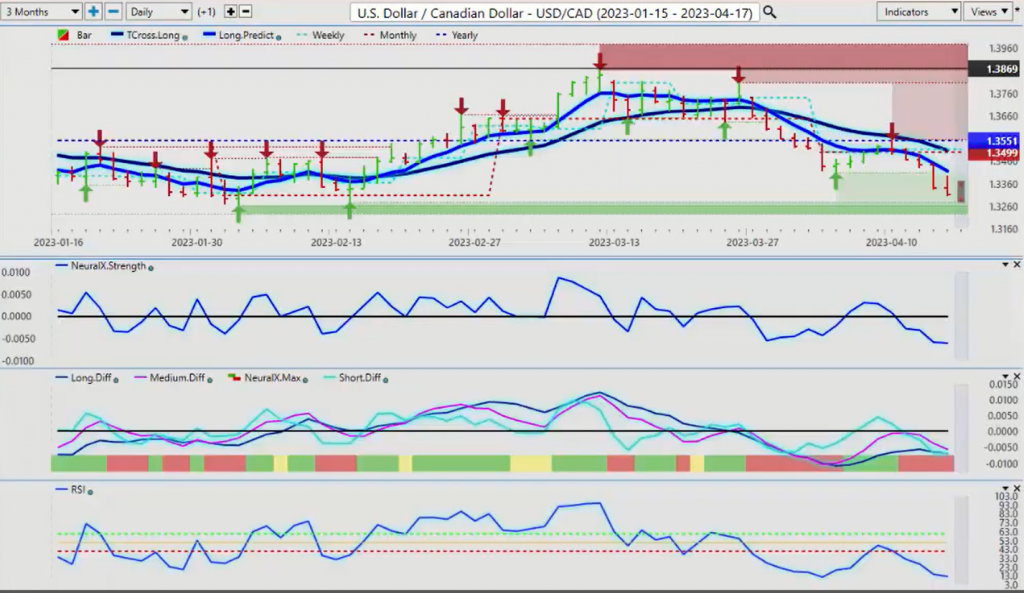
The US Canadian pair, once again, the intermarket correlation dependent on additional stock market strength, additional strength in oil prices. If we don’t get that, US/Canada will reverse. We have a very, very strong verified support zone at 132.63. Small longs could be attempted at that area, but that’s provided we get some kind of rebound off that verified support low on the dollar index. That level again is coming at approximately the 100.82 level.
Australian Dollar versus U.S. Dollar
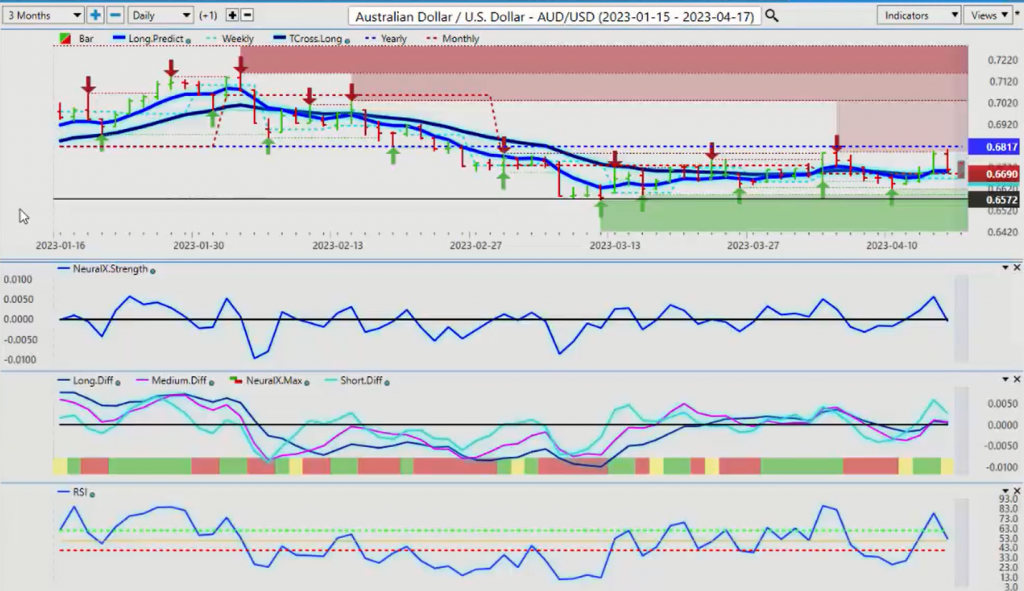
Now the Aussie and the Kiwi, they too will both follow the US CAD. US CAD goes down, Aussie/Us, New Zealand/Us, they go up. That’s how this works, guys. Very strong correlation.
Now you can see on Friday the benefit of applying the yearly opening price on any market that you’re trading. This is not a coincidence, guys, that we have failed two days in a row. On Friday we made a push towards that yearly opening price and then an epic fail from that particular level. So again, that yearly opening price is acting as a pivot level or basically a trend to finding non indicator where we must, in order to turn positive, we must clear that.
But when and if we do clear 68.17, you will likely see a substantial rise on this particular pair. So one of the other ways you can play this is just ignore this chop and just put a buy limit order above 68.17, about 68.40. We clear this, then you’re going to have likely have a very quick move up towards the high of 70.29.
New Zealand Dollar versus U.S. Dollar
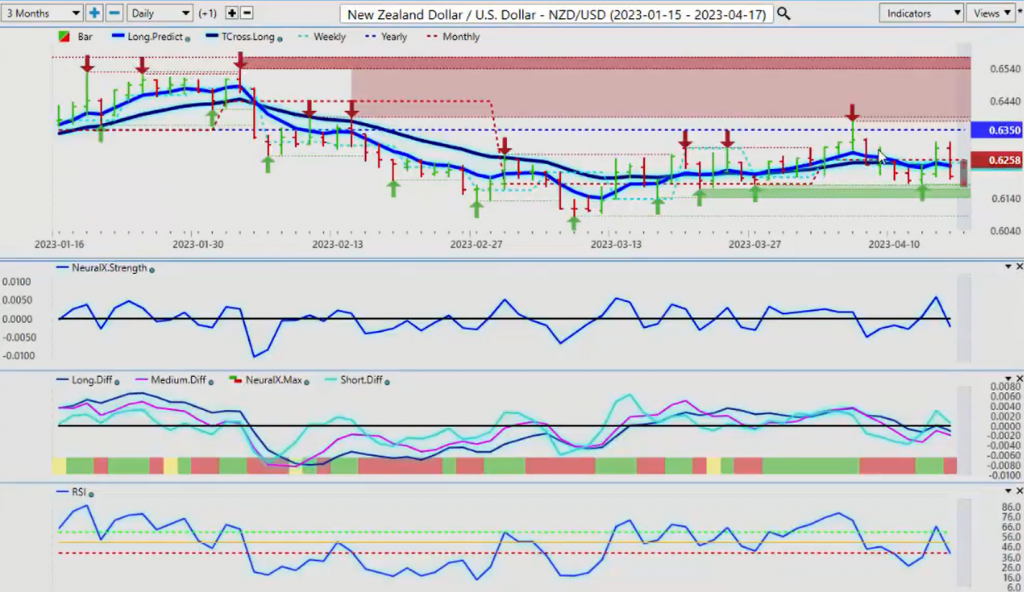
The New Zealand, basically the same trade as the Aussie/US. We would play it essentially the exact same way, guys. What we’re looking for is again, a pop forward. We’ve got strong verified support on the keyway at 61.68. But again, if we can get back up and test 63.50 and break through there, then we should have a clear run at least up into the 65 area. So it should be another interesting week, but with that will always come opportunity. So with that said, this is the VantagePoint AI market outlook for the week of April 17th, 2023.

#Vantagepoint #Market #Outlook #April