Welcome to the Artificial Intelligence Outlook for Forex trading.
VIDEO TRANSCRIPT
U.S. Dollar Index ($DXY)
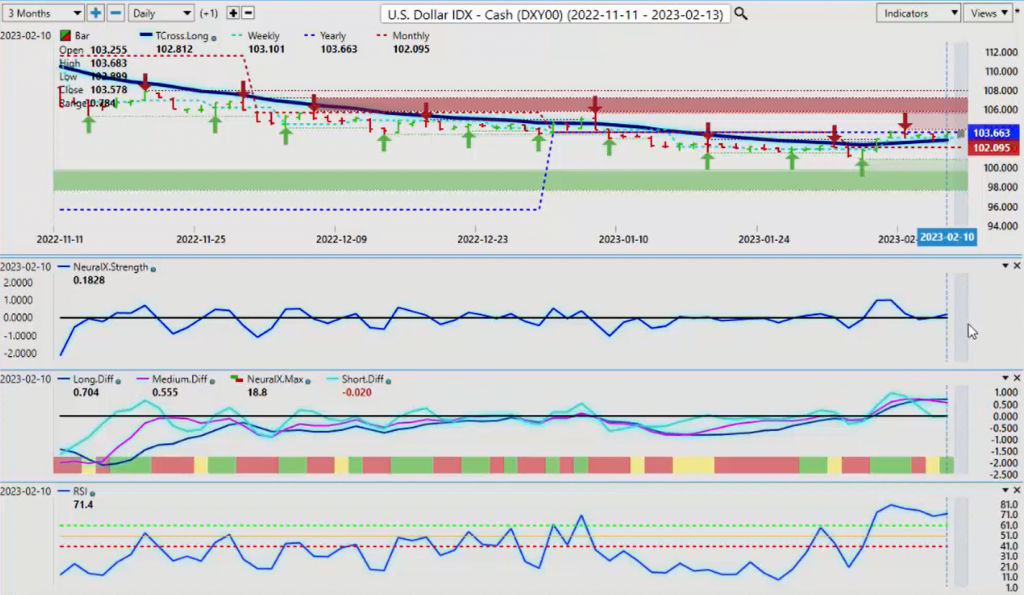
Hello, everyone, and welcome back. My name is Greg Firman, and this is the VantagePoint AI Market Outlook for the week of February the 13th, 2023. Now, to get started this week, where we always do with the U.S. Dollar index, now, things pretty much playing out as discussed in last week’s weekly outlook, where we’ve got a rally on the dollar on Monday, and then on Tuesday, we sell off, and we were unable to make any further gains after Tuesday. Now, this was discussed at length in last week’s presentation, where in most cases, the dollar loses momentum the week after the non-farm payroll regardless of what that payroll number is, so once again, that has come to fruition. Now, again, your support level is pretty easy to see down here, where most can see, but what most are not looking at is the resistance point, the yearly opening price.
Now, the dollar, regardless of media spin and different websites and everything else, the dollar is still negative on the year. It is not at an uptrend, so what we’re looking for, what I would advise to be very, very cautious of next week is a bull trap around this particular area. Now, what I mean by that is a big push on Monday and exactly what we saw last week on Tuesday only for it to completely reverse. So in my respectful opinion only, we are holding above the VantagePoint T cross long. We’ve had the inevitable retracement to it, but we’re still not closing above 103.66, what’s highlighted in blue, which is the yearly opening price.
S&P 500 Index
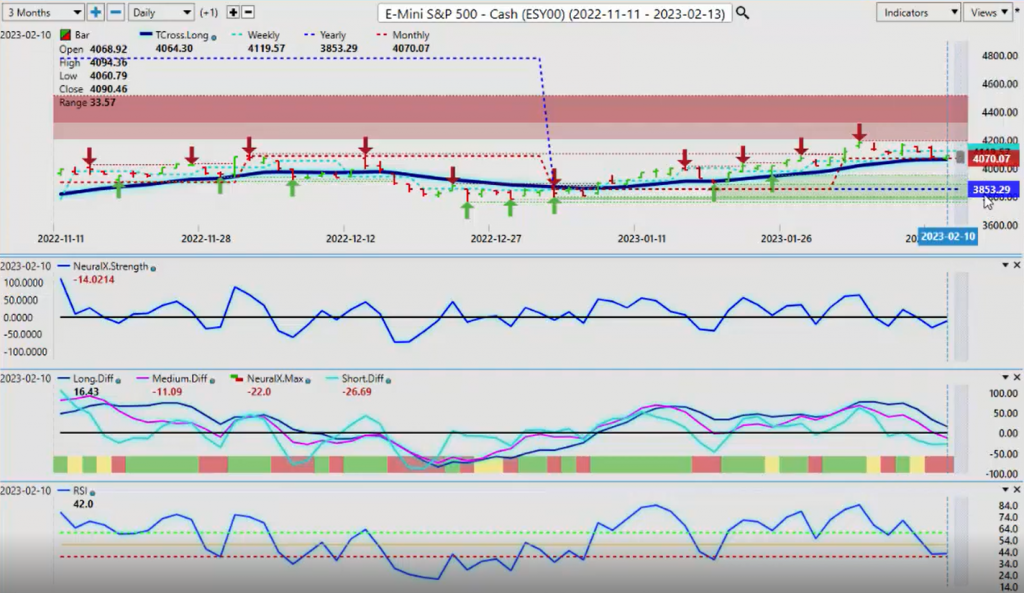
It’s an indisputable fact the dollar is not bullish on the year while it remains negative, so what we would be looking for is a sustained break of 103.66, but again, be very, very cautious of a potential bull trap up here because when we cross-reference the U.S. Dollar to its known adversary, the inverse correlation to the equity markets, we can see that the S&P 500 is firmly above its yearly opening price at 3853, and we’re holding above the VantagePoint T cross long, so again, the global stock indexes have plenty of room to retrace. Now, when we look closer again at that Dollar index, one of the warning signs that we can see in the VantagePoint software is the medium-term crossing the long-term predicted difference. This is warning us that we’re losing momentum, that the medium-term trend is weakening against the longer-term trend. Now, either this is going to go here or it’s not. It’s a very, very mixed signal, but the only level you need to know for next week is 103.66 because this happens very often, where analysts will discuss at length a support or resistance, but they won’t discuss both, and at 103.66, that is a very crucial level for the dollar to overtake.
We are in a period of known dollar strength from a seasonality standpoint, but again, the dollar had such excessive gains in 2022, that it’s unlikely to repeat in 2023. So when we look at that, we can assess that, again, the stock market, for the most part, is still holding onto its gains. Now, our T cross long here, 4064. We’re closing at 4090, so we’ve come down, tested that level two days in a row, but a very shallow bounce on Friday with a bit of a risk-off scenario. Now, the predicted differences are pointing down, so this does potentially breathe life into the dollar, but the dollar needs stocks lower, period, full stop, so if we don’t get that, then the dollar resumes, it’s moved lower, and remains negative on the year, and stocks remain positive on the year. I think that’s what a number of analysts are looking for. I’m on the fence at this current time.
I think it’s too early to tell, but again, whether you’re a Forex trader or a stock trader, keep a very close eye on 103.66 on the dollar index.
Bitcoin
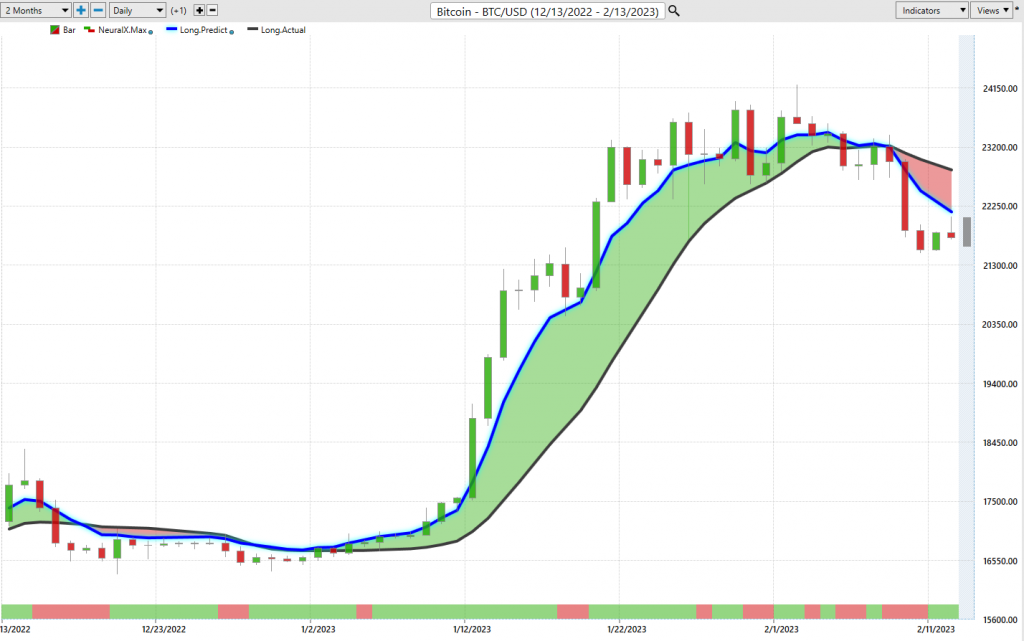
Now, with stocks moving lower, once again, as I’ve discussed on here before, there’s a lot of heavy debate on Bitcoin. The reality here, guys, is that Bitcoin is about 98% positively correlated to the global stock market, so Bitcoin is slipping a little bit here, so this would suggest that if Bitcoin keeps moving lower, stocks will follow, but again, we’re firmly above the yearly opening price, 16,541. This is a very important level at this time of the year to make sure that Bitcoin and the S&P are holding above those particular levels. Now, it looks like we’re going to see further downside before we turn around, but again, watch these levels very, very closely.
The T cross long, 22,598. If we can retake that level by Tuesday or Wednesday of next week, that will confirm that the dollar is not likely to break out at this particular time.
Crude Oil
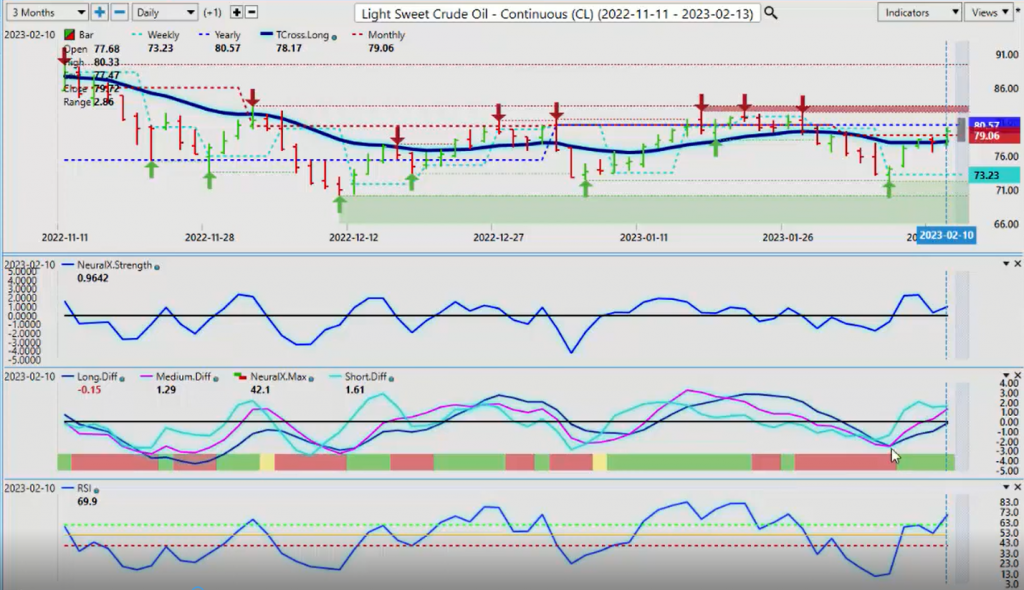
Now, again, looking at the energy sector, Light Sweet Crude Oil, we can see that crude oil is starting to recover and yet another indicator that’s not necessarily positive for the U.S. dollar, so as we’re starting to move higher, we can see there is a correlation there, but there’s the MA diff cross also in reverse, warning us when the neural index goes from red to green. The pink line crosses the blue line, measuring the medium-term against the long-term crossover. We can see there was a nice rise on that.
Now, again, the yearly opening price on this particular class is 80.57, so in order for oil to officially be bullish, like the dollar, we must clear this level and turn positive on the year. Currently, we’re still negative on the year, guys, so if we can get above 80.57, then we could possibly see oil rise further, but my optimism on that at this particular time remains heavily guarded. Again, even if we get past the yearly opening price here, verified resistance is very stiff at 82.48. Now, as we look at some of our main …
Gold
Well, actually, we’ll look at gold first, excuse me.
So with gold, once again, this was discussed in the previous weekly outlook, that gold didn’t really stand much of a chance this week with this dollar strength, but now, you can see that again, we’re we’re starting to flatten out. 1824 is a major support level at this time of year, guys. The yearly opening price determines whether something is technically bullish or bearish. If it’s positive on the year, it’s bullish. If it’s negative on the year and it’s losing money, then it can’t hardly be bullish.
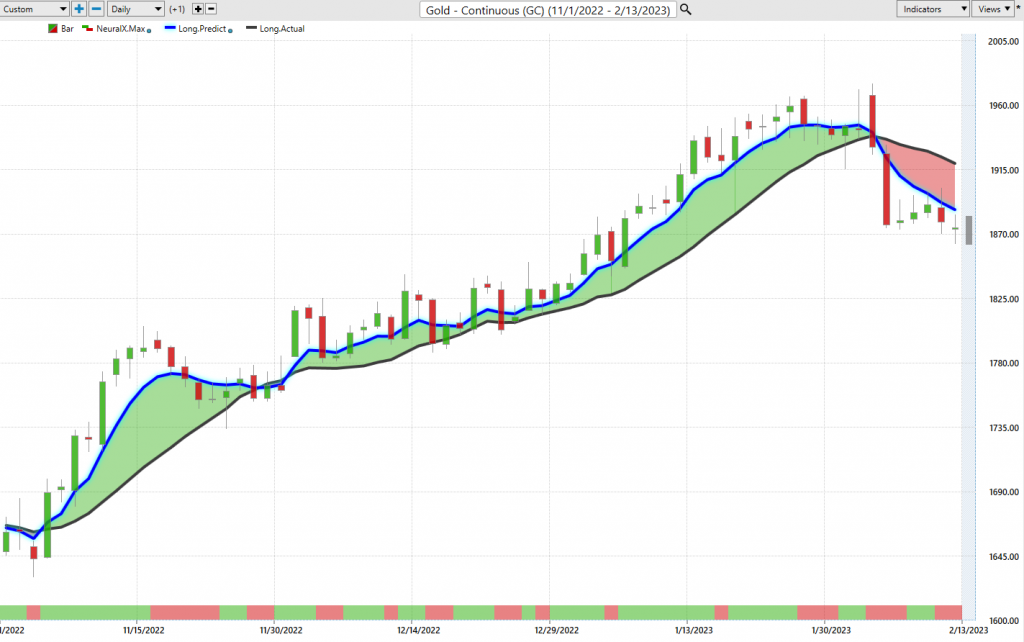
Now, they’re still calling for a bullish move on gold. Regardless of what the dollar does here, in my respectful opinion, I think gold is going to struggle till probably that seasonality kicks in closer to April. I would keep an eye on it around that particular time, but for now, the indicators are warning yet another signal that the dollar may not be able to hold on to these gains. The MA diff cross, the pink line over the blue line, all we have to do now is get this neural index on board, the neural index strength on board, and we should see gold turn around to some degree, but again, in my respectful opinion, not likely going to be a great year for gold, unless we do globally go into a recession.
Euro versus U.S. Dollar
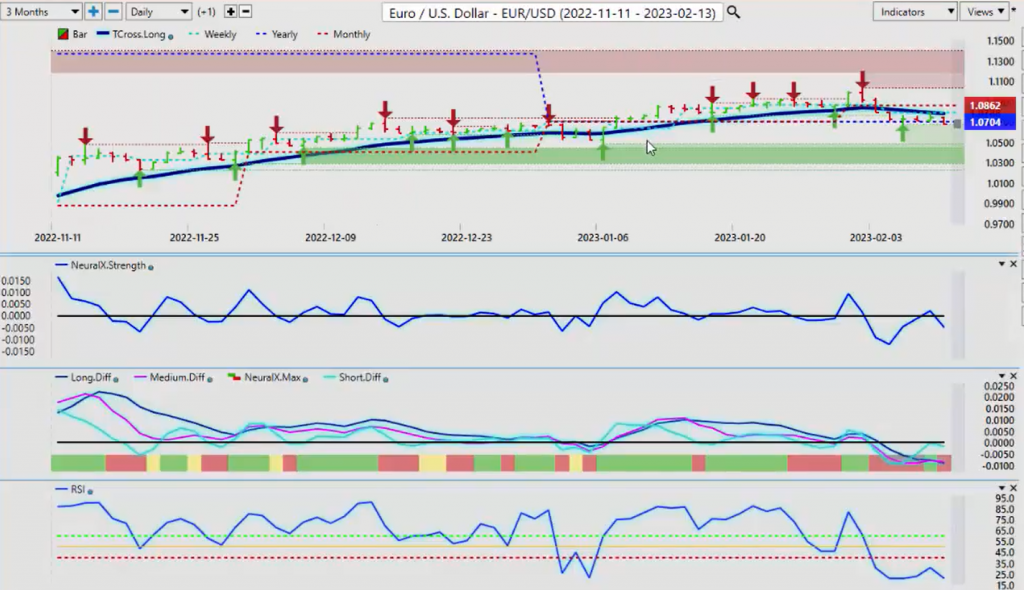
Now, with that drop in gold prices, the currency pair that was the most affected by that was clearly the Euro/U.S., so the Euro slipped and we’ve come down, but you’ll also notice here, this is a great example of the yearly opening price, 1.0704, we’re closing 1.0678.
Again, in my respectful opinion only, we would need a two or three-day close below 107, and again, I think either way, we’re likely going to be limited on the downside to about the 105 area, maybe slightly above 105, because the ECB is going to keep hiking. The Fed is not. They’re likely going to pause here soon, but either way, the correlation the Euro has to gold futures contracts is about 85 to 90%, so when gold started falling, the U.S. dollar’s correcting higher towards its yearly opening price. None of this helps the Euro, so if you’re trading the Euro/U.S. payer next week, keep a very, very close eye on gold contracts, the dollar index, and even the S&P 500, but for now, 1.0872 is our immediate resistance, and again, our monthly opening price is a big level also. 1.0862, we’re below the monthly opening price, so it’s technically, has a bearish formation because the Euro actually has now turned negative on the year.
This could be a leading indicator that the dollar index is getting ready to pop to the upside, but the question remains, “How much of a move up can the dollar make if it even makes it at all?”
U.S. Dollar versus Swiss Franc
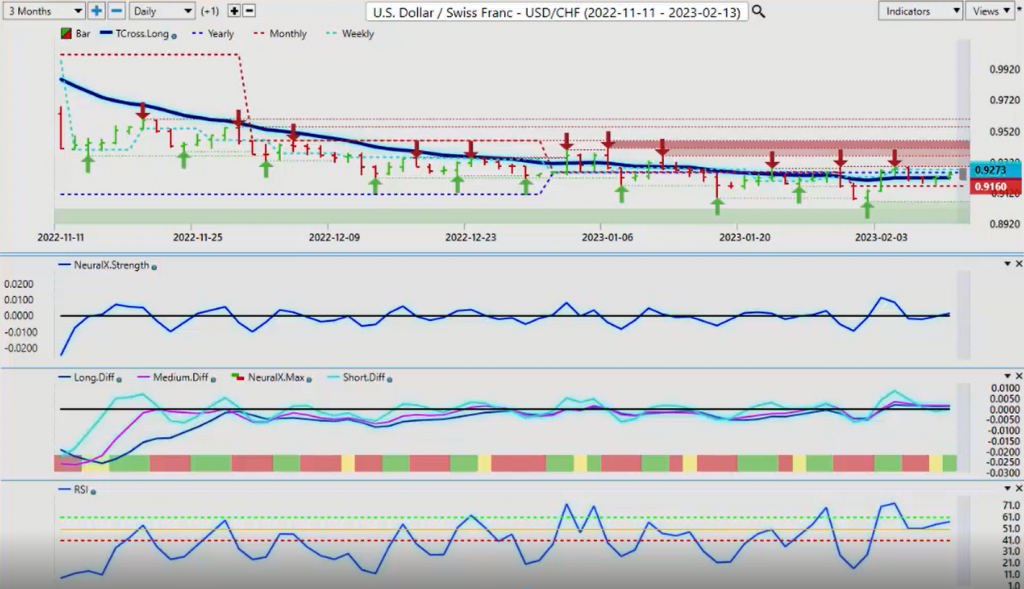
Now, with the U.S./Swiss Franc, again, about 85% correlated to the dollar index. You can see that U.S./Swiss Franc also struggling with this yearly opening price at 0.9251. We’ve closed at 0.9237, still unable to hold above the yearly opening price this year, so the indicators right now are basically neutral. Predicted difference is sideways. The neural index strength is showing there’s still some upward momentum, and I believe it will move higher on Monday.
I just question whether it will move higher on Tuesday and Wednesday. Monday to Tuesday, 90% of the time, the markets reverse from Monday to Tuesday for unexplained reasons, and then the primary trend will usually kick in at a high volume trade on Wednesday, triple swap day in the Forex market. So again, we’ll keep an eye on this, but if this pair is going to be bullish, we must clear 0.9251 and stay above this level to be very, very clear.
British Pound versus U.S. Dollar
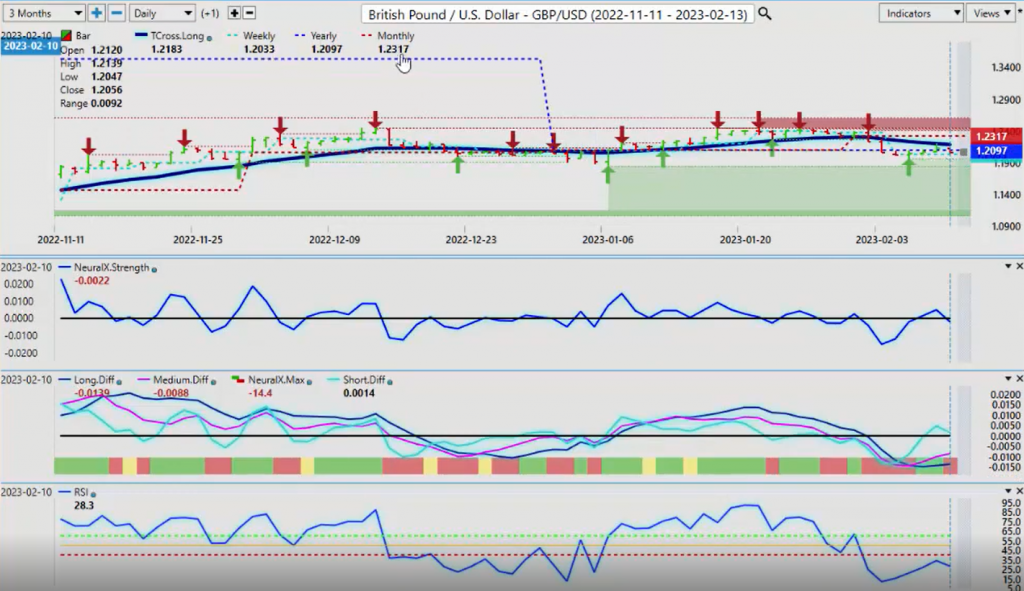
Now, the Pound/Dollar, once again, struggling too. We’ve got 1.2097 as our yearly opening price.
We’re closing 1.2056, so we’ve come up, tried to get above it. You can see that the market has come up to the VantagePoint predicted moving average, the T cross long only to fail and move back down, but it’s a very shallow move. We’ve got our MA diff cross, which is crossing to the upside. The neural index is very mixed, but that MA diff cross is seldomly wrong, and if nothing else, it warns us to be very cautious of shorts down at this particular level. This has the makings also of a bear trap, so we’ve got to be cautious around this particular area and let the market break free and clear of this.
We should get a true price by midday Tuesday, but be very careful from Monday to Tuesday. If you get a big move down on Monday, you could get an equal move or bigger on Tuesday.
U.S. Dollar versus Japanese Yen
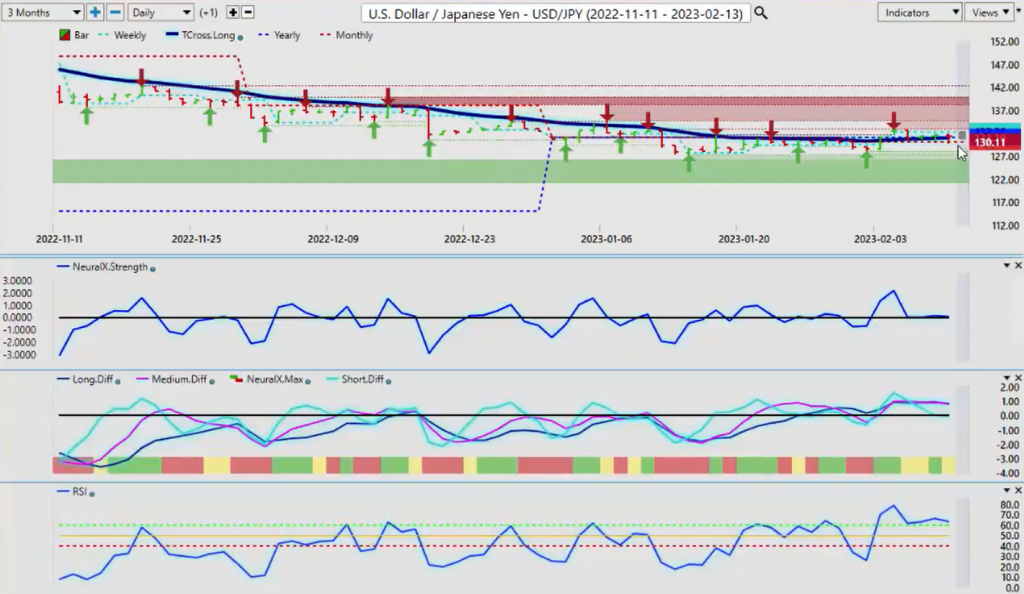
Now, as we look at the Dollar/Yen, the Dollar/Yen reacting to some dollar strength, but still, pretty much sideways. The neural index strength is sideways, predicted differences. The neural index going from yellow to green. Very, very sideways here.
So once again, the yearly opening price, 131.10, this is a very important level at this time of the year, because this is the only true way to determine if something is bullish or bearish, of whether it’s positive or negative on the year. A trending move will form, guys, probably this month, but we want to let that move show itself, and right now, dead sideways. We’ve got verified resistance at the 132.90 area. Sellers are sitting there. You can see we came up there on the seventh only to turn right back down again.
Going sideways again, and then pretty much flat on Friday, so again, I would look for a break of the yearly opening price and that high at 132.90 if this pair has any chance of moving back up to 2022 levels.
U.S. Dollar versus Canadian Dollar
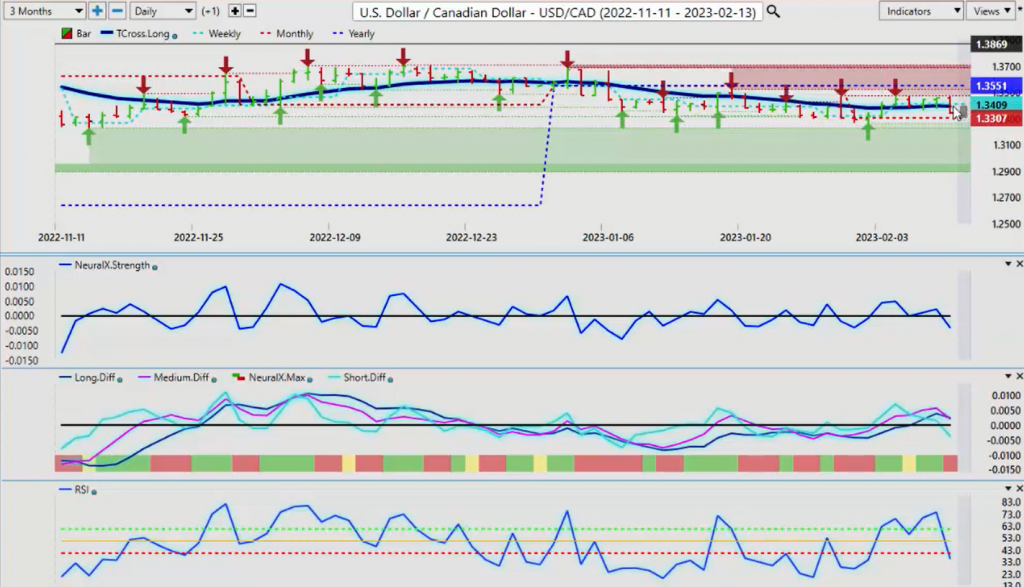
Now, with the main equity-based currencies, the U.S./CAD, the Aussie/U.S., New Zealand/U.S., these currencies are predominantly determined by the strength or whether the global indexes, stock indexes are healthy or not, so the CAD has got a bit of a bump to the downside today based around the Canadian unemployment numbers, but again, 150,000 jobs, but the unemployment rate didn’t go down, so that tells me that, “Well, the jobs number in Canada is probably not as strong as what they’re making it out to be, and there could be downward revisions coming next month.” So right now, we are below the yearly opening price, but as you can see down here, the monthly opening price at 1.3307, we’ve been above it this entire month so far so watch for … If this is really going to turn bearish, we need to break and stay under 1.3307. The indicators right now are pointing down, but the predicted differences are still above the zero line, warning us that potentially, this is just a corrective move down because again, I question how strong that Canadian labor market really is, because again, the Bank of Canada is likely looking at, at least pausing and maybe even cutting in the months ahead, which does not bode well for the Canadian Dollar at all.
For next week, 1.3307 is our support level, and then we want to see if we can hold above this, get back above the VantagePoint T cross long at 1.3395.
Australian Dollar versus U.S. Dollar
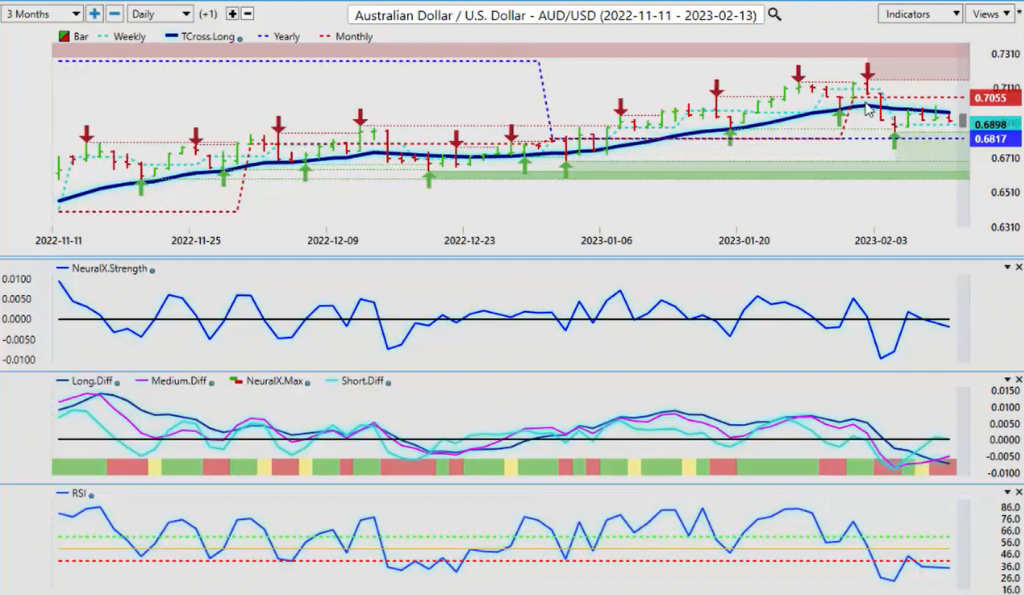
Now, the Aussie had a pretty epic failure this month already, up here at about the 0.7158 level. A new verified zone is now formed there. We have a strong verified support at the yearly opening price, 0.6817, so once again, if the index cannot clear 103.66, the S&P 500-Bitcoin rebound, the Aussie will follow. That’s what you’re looking for next week, because again, this is an outlook, not a recap of something that already happened.
Very important. There’s a big difference there. So again, these levels are being pre-identified prior to the market even opening. You can see that this presentation is being done on Friday evening at 7:41 PM. The markets are closed.
So again, these levels are important. 0.6817, if the Aussie cannot break through there, stocks reverse, then the Aussie will reverse. You will see the exact same thing with the Kiwi. Right now, the Kiwi, however, is softer, much softer than the Aussie. It’s broken down below its yearly opening price.
One could assess that potentially, that the Aussie’s getting ready to follow. However, the MA diff cross, the pink line over the blue line is saying, “We are losing momentum to the downside,” not gaining, which points towards a stronger stock market and a weaker dollar, so this will be an epic battle next week on Monday and Tuesday as to who actually wins this battle between the dollar and stocks, but right now, it’s pretty much a dead heat, but the Aussie, the Kiwi, the S&P 500, they’re still relatively bullish on the year, where again, the Dollar is not, but that could change next week.
New Zealand versus U.S. Dollar
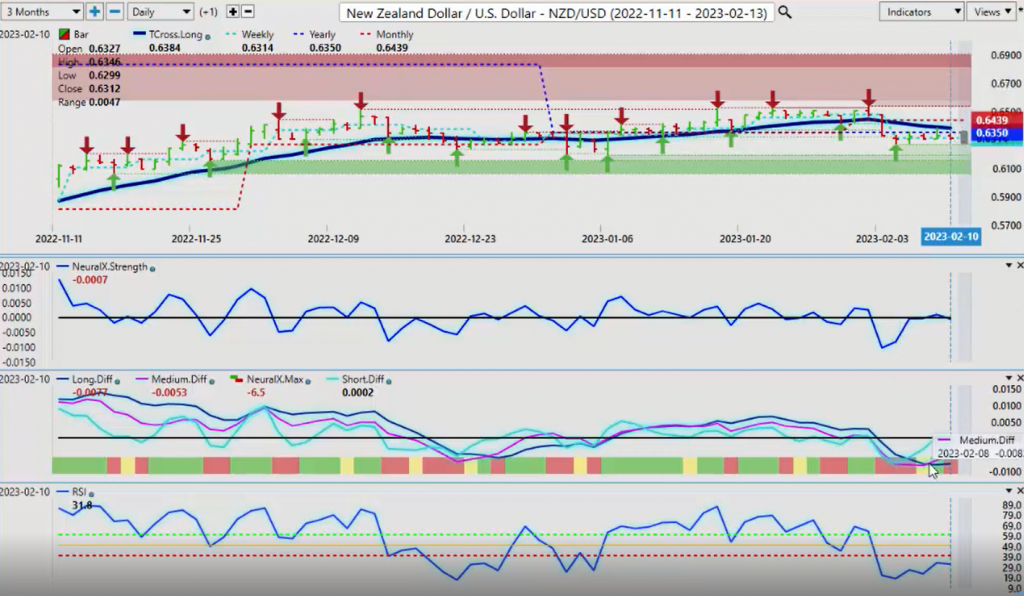
Just know your levels. So with that said, this is the VantagePoint AI Market Outlook for the week of February the 13th, 2000-

#Vantagepoint #Market #Outlook #February